-
- [White Papers] AI-Based No-Reference Video Quality Assessment for the 5G and 6G Era
- AI-Based No-Reference Video Quality Assessment for the 5G and 6G Era Standardization Trends, VQML® Algorithm Overview, and Use Cases with XCAL Doc Rev : 1.0.0July 2026 © 2026 LIG Accuver Co., Ltd. All rights reserved. This document may not be reproduced, distributed, disclosed to third parties, or modified without prior written permission from LIG Accuver. LIG Accuver shall not be liable for any direct or indirect loss arising from the use of this document. All information contained herein is subject to change without prior notice. Contents Executive Summary4 1. ITU-T Video Quality Assessment Standardization Trends5 1.1 Role of ITU-T SG12 in QoS and QoE Standardization5 1.2 J Series and P Series: Complementary Perspectives5 1.3 Full-Reference, Reduced-Reference, and No-Reference Methods6 1.4 The Approved ITU-T J.344 Framework7 1.5 Standardization and Commercial Significance7 2. Algorithm Overview: LIG Accuver VQML®8 2.1 What Is VQML®?8 2.2 Input and Output Structure8 2.3 Model Architecture: Evolution from CNN + GRU to Transformer + CNN9 2.4 Multi-Score VQA Architecture9 2.5 Performance Evaluation and Benchmark Results10 3. VQML®-Enabled QoE Assurance and XCAL Use Cases11 3.1 From Network KPIs to User-Perceived QoE11 3.2 Greater Interpretability through XCAL Integration11 3.3 Representative XCAL Use Cases11 3.4Deployment Configurations and Commercialization Roadmap13 4. Conclusion14 Selected Standards and Technical References15 About LIG Accuver15 Executive Summary Video has become one of the clearest indicators of mobile network performance. Users judge service quality through playback continuity, visual clarity, synchronization, and responsiveness—not through radio and transport metrics alone. As operators move toward 5G Standalone and future 6G architectures, assurance must connect network KPIs with application-level Quality of Experience (QoE). LIG Accuver’s VQML® estimates human-perceived video quality directly from received RGB frames without the original source, transmission metadata, or manual subjective testing. Integrated with XCAL, it enables real-time and session-level MOS estimation in laboratory, field, device, and live-service environments. Adopted as Model A in the approved ITU-T J.344 framework, VQML® combines content, signal, perceptual, and device-aware analysis. XCAL can correlate the predicted MOS with radio and protocol logs to help identify likely factors associated with service degradation. 1. ITU-T Video Quality Assessment Standardization Trends 1.1 Role of ITU-T SG12 in QoS and QoE Standardization ITU-T Study Group 12 (SG12) is the ITU-T study group responsible for performance, Quality of Service (QoS), and Quality of Experience (QoE). Its work covers network performance, speech and audio quality, multimedia services, and subjective and objective quality assessment methodologies. For video services, SG12 recommendations provide a common technical foundation for measuring how coding, transmission, capture devices, displays, and application behavior affect perceived quality. These methods are used by telecom operators, network equipment vendors, device manufacturers, service providers, regulatory authorities, and research laboratories. The role of perceptual assessment is becoming more important as 5G SA and future 6G networks introduce network slicing, private networks, mission-critical communications, and application-specific Service-Level Agreements (SLAs). Radio metrics such as signal strength, throughput, latency, and packet loss remain essential, but they must be supplemented with measurements of the service experience delivered to the user. 1.2 J Series and P Series: Complementary Perspectives Two ITU-T recommendation series are especially relevant to video quality assessment: Standard SeriesPrimary FocusPractical MeaningRepresentative ExamplesJ SeriesPerceptual video-signal quality for television, broadcasting, cable, and multimedia transmissionMeasures visual degradation caused by coding, processing, cameras, and transmission. Includes full-reference, reduced-reference, and no-reference approaches.J.144, J.246, J.343 series, J.344 seriesP SeriesSubjective and objective assessment of communication-media quality and end-user QoEAddresses terminal- and display-based assessment, audiovisual service quality, streaming quality, and end-user perception.P.910, P.1204 series Table 1. Complementary roles of the ITU-T J and P series In practical terms, the J Series focuses primarily on the perceptual integrity of the received video signal, while the P Series takes a broader view of user-perceived communication-media and service quality. Using both perspectives enables a more complete QoE assurance framework. 1.3 Full-Reference, Reduced-Reference, and No-Reference Methods Video Quality Assessment (VQA) methods are categorized by the amount of information required from the original source signal: MethodRequired InputRepresentative ITU-T StandardsStrengthsLimitations and Typical UseFull-Reference (FR)Complete source video and processed or received video; accurate alignment is normally required.J.144; J.343.5–J.343.6; P.1204.4Typically provides high precision because the complete source reference is available.Best suited to codec development, equipment benchmarking, and controlled laboratory validation. Difficult to deploy in live or user-side monitoring.Reduced-Reference (RR)Received video plus selected features extracted from the source and transferred through a reference-side channel.J.246; J.343.3–J.343.4; P.1204.4Reduces reference-data overhead while retaining partial source information.Requires reference-side feature extraction, synchronization, and side-channel delivery. Applicable when a controlled reference path is available.No-Reference (NR)Received video, metadata, or bitstream information without the complete original source. Pixel-based NR models can operate directly on decoded RGB frames.J.343.1–J.343.2; J.344.1–J.344.2; selected P.1204 modelsMost practical for field, black-box, end-user, and live-service measurement.Technically demanding because perceptual degradation must be inferred without a complete reference. Model behavior depends on the available input type and training coverage. Table 2. Comparison of reference requirements and deployment characteristics FR and RR remain valuable when source-side data can be controlled. Their dependence on source access and synchronization, however, limits their scalability in live, multi-vendor mobile environments. NR assessment is therefore the practical foundation for broad field and service monitoring. NR models also differ in their inputs. Metadata-driven models, such as P.1204.1, estimate quality from encoding and service parameters. These inputs may be unavailable in encrypted services and may not expose pixel-level visual defects. The J.344 approach addresses this limitation by predicting perceived quality directly from received RGB video without requiring the original source or transmission metadata. Advanced AI and perceptual deep learning architectures are required to overcome the computational complexity of pure RGB analysis—a challenge that LIG Accuver has successfully solved. 1.4 The Approved ITU-T J.344 Framework The J.noref work item established a standardized approach for objective no-reference assessment of Full HD video. This work matured into the approved ITU-T J.344 recommendation family, which provides the framework and model definitions for advanced NR objective VQA. StandardScopePrimary Impairment FocusJ.344Framework and umbrella recommendation for no-reference objective VQA of Full HD videoOverall architecture, evaluation principles, and model frameworkJ.344.1No-reference objective VQA model for coding artifacts in Full HD videoCoding artifacts caused by video compression, including quantization-related degradationJ.344.2No-reference objective VQA model for coding artifacts and camera impairments in Full HD videoCoding artifacts and capture-side camera impairments, including blur, camera shake, focus errors, sensor noise, and lighting-related degradation Table 3. Structure of the approved ITU-T J.344 recommendation family This structure reflects real deployment conditions. Video degradation is not caused by compression alone; video conferencing, live broadcasting, surveillance, and mobile camera applications are also affected by focus instability, camera motion, low-light noise, and other capture-side impairments. VQML® was selected as Model A within the J.344 standardization framework. It satisfies the requirements of both J.344.1 and J.344.2. According to the final standardization records, VQML® is the only no-reference model registered across both recommendations and the sole registered model in J.344.2. 1.5 Standardization and Commercial Significance The approved J.344 family gives telecom operators, regulatory authorities, device manufacturers, and digital video service providers a consistent, repeatable, and internationally recognized framework for video quality assessment. A common benchmark reduces ambiguity when comparing networks, devices, applications, and equipment vendors. For LIG Accuver, the J.344 standardization process strengthens the commercial credibility of VQML® and provides a common technical basis for deploying its perceptual quality measurements within XCAL-based validation workflows. 2. Algorithm Overview: LIG Accuver VQML® 2.1 What Is VQML®? VQML® (Video Quality Machine Learning) is LIG Accuver’s proprietary AI-based no-reference video quality assessment engine. It estimates human-perceived quality using decoded RGB frames from the received video and outputs a predicted Mean Opinion Score (MOS) on a 1-to-5 scale: 1 Bad, 2 Poor, 3 Fair, 4 Good, and 5 Excellent. The approved J.344 standardization scope focuses on Full HD signals. The commercial VQML® implementation has additionally been evaluated across resolutions from 144p to 2160p (4K UHD) and across major codec formats, including H.264, H.265/HEVC, and AV1. These broader commercial validation conditions are distinct from the formal J.344 evaluation scope. 2.2 Input and Output Structure Figure 1. VQML® input, processing, and predicted MOS output • Input: Decoded RGB frames captured from the received video through screen recording, HDMI capture, or virtual-camera interfaces. • Processing: Deep learning modules analyze spatial artifacts, temporal consistency, content context, and device-related viewing conditions. • Output: Time-based MOS estimates and a session-level average MOS, with supporting sub-scores for specific quality dimensions. This streamlined input-output structure enables black-box testing of supported video, social-media, conferencing, and communication applications without requiring modification of the target application or access to its internal delivery metadata. 2.3 Model Architecture: Evolution from CNN + GRU to Transformer + CNN Earlier VQA architectures commonly used Convolutional Neural Networks (CNNs) to extract localized spatial features—such as edges, textures, blockiness, and blur—from individual frames, while Gated Recurrent Units (GRUs) modeled short-term temporal changes. This structure was effective for basic coding artifacts but had limited ability to represent broader scene context, long-range temporal relationships, and semantic intent. VQML® uses a Transformer + CNN hybrid architecture to analyze video impairments based on the semantic, technical, and aesthetic characteristics of the content. CNN-based components detect fine-grained technical artifacts, while self-attention modules interpret broader scene context and aesthetic intent, helping distinguish intentional characteristics—such as artistic blur, fast motion, or dark scenes—from actual quality degradation. The model then accounts for device-specific factors that affect perceived visual quality and synthesizes these results into a final MOS prediction. 2.4 Multi-Score VQA Architecture Rather than producing an undifferentiated black-box score, VQML® evaluates multiple dimensions of visual quality and synthesizes them into the final predicted MOS: . Figure 2. Evolution from a conventional single-score architecture to the VQML® multi-score architecture ModuleMain FunctionRole in MOS PredictionContent-Based ScoreAnalyzes scene complexity, motion dynamics, and semantic characteristics.Reduces false penalties by distinguishing intentional visual properties from technical distortion.Signal Quality ScoreQuantifies technical degradation associated with compression, quantization, transmission loss, and playback interruption.Detects artifacts such as macroblocking, mosquito noise, ringing, and freezing.Visual Quality ScoreEvaluates optical and capture-side impairments.Accounts for camera defocus, motion shake, poor lighting, and sensor noise that influence real-world perception.Device CalibrationAccounts for display resolution, pixel density, and rendering characteristics.Adjusts the predicted quality estimate for the characteristics of the target viewing device.Final MOS EngineSynthesizes the branch-level scores through a learned prediction model.Delivers a human-aligned predicted MOS on the 1-to-5 scale. Table 4. Functions of the VQML® multi-score architecture 2.5 Performance Evaluation and Benchmark Results VQML® was evaluated on the ITU-T standardization dataset under controlled and consistently applied test conditions. Pearson Linear Correlation Coefficient (PLCC) was used to measure how closely each objective model tracked human subjective quality scores. A value closer to 1 indicates stronger linear correlation. Figure 3. PLCC comparison on the ITU-T standardization dataset. Source: LIG Accuver evaluation results; performance metrics internally verified. VQML® achieved a PLCC of 0.9041, outperforming Model B, Model C, Model D, and Model E under the same dataset and test conditions. Further evaluation on a dataset containing severe coding artifacts yielded a Root Mean Square Error (RMSE) of 0.4384 and a False Ranking Ratio (FRR) of 4.01%. By comparison, the other evaluated models recorded RMSE values above 0.5, while their FRR values were substantially higher than that of VQML®. Together, these results demonstrate that VQML® provides stronger alignment with human subjective quality judgments, lower prediction error, and more reliable quality-ranking consistency under the evaluated conditions. 3. VQML®-Enabled QoE Assurance and XCAL Use Cases 3.1 From Network KPIs to User-Perceived QoE In 5G SA and future 6G architectures, assurance is expanding from RF optimization to application- and SLA-level verification. RSRP, SINR, throughput, latency, and block error rates remain foundational, but they do not directly describe whether a subscriber experienced clear, stable, and responsive video. VQML® adds an application-layer quality metric that can support SLA thresholds for premium video conferencing, cloud gaming, remote monitoring, and other real-time visual services. XCAL can evaluate predicted MOS together with initial loading behavior, adaptive-resolution changes, playback interruptions, and cellular signaling conditions. 3.2 Greater Interpretability through XCAL Integration Conventional handcrafted NR models such as BRISQUE and NIQE rely primarily on natural-scene statistics. They can detect deviations from expected image statistics but provide limited semantic, temporal, and root-cause-level interpretability. VQML®’s multi-score architecture provides more structured insight into the type of degradation being observed. When a signal-quality score drops because of blockiness or freezing, XCAL can align that timestamp with radio and protocol logs. This correlation helps engineers identify likely contributing factors, such as handover instability, scheduling congestion, uplink or downlink impairment, or physical-layer interference. Correlation narrows the investigation; final root-cause confirmation remains an engineering validation step. 3.3 Representative VQML® and XCAL Use Cases 1. Mobile Video Platforms and Short-Form QoE Benchmarking With VQML® integrated into XCAL, operators can conduct automated drive tests across online video and short-form platforms such as YouTube, TikTok, Instagram, and local streaming services. Received RGB video and cellular signaling are captured under comparable mobility conditions, enabling objective comparison of predicted MOS, adaptive-resolution behavior, buffering, and visual artifacts across carrier networks. 2. Video Conferencing and Real-Time Collaboration Validation Enterprise tools such as Zoom, Microsoft Teams, and Webex are sensitive to jitter, uplink packet loss, device processing, and camera quality. VQML® can estimate live two-way video quality without a source reference, while XCAL records the associated network conditions. Engineers can evaluate facial clarity, motion continuity, macroblocking, and session stability. 3. Mission-Critical Communications and Public-Safety Networks VQML® has been commercially validated in disaster-network verification projects associated with Korea’s public-safety communications environment. In mission-critical scenarios, the combined VQML® and XCAL workflow supports evaluation of whether live video retains sufficient visual clarity during congestion, mobility, and degraded radio conditions. 4. CCTV, Smart-City Surveillance, and Camera Benchmarking Capture-side defects may occur before video enters the IP network. Focus drift, low-light noise, environmental vibration, and camera motion can reduce visual usability even when network KPIs are normal. The J.344.2-aligned capabilities of VQML® support scalable screening of camera feeds for both capture-side and coding-related degradation. 5. Controlled Laboratory Network Validation at Nokia Lab At Nokia Lab, VQML® is used with XCAL’s Virtual Camera function to benchmark network equipment and QoS configurations. A standardized high-definition test sequence is injected into a smartphone camera pipeline, transmitted through the test network, and decoded on the receiving device. VQML® then evaluates the received RGB stream. This method combines laboratory repeatability with realistic end-device behavior and helps isolate network-induced changes under controlled conditions. 6. 6G Immersive Media: XR, Spatial Computing, and 360-Degree Video Immersive video introduces dynamic viewports, head-tracking, rendering latency, and spatially varying quality. These characteristics make conventional reference-based assessment operationally complex because the evaluated viewpoint changes with user movement. VQML®’s pixel-based NR architecture provides a foundation for future evaluation of viewport clarity, rendering artifacts, and perceptual consistency across AR, VR, and spatial-computing devices. 3.4 Deployment Configurations and Commercialization Roadmap VQML® is planned for delivery in three deployment forms: GPU-server, PC, and mobile, allowing customers to select an implementation suited to their processing requirements, test scale, and operational environment. The GPU-server option is intended for centralized or high-volume processing, while optimized and lightweight PC and mobile implementations are being prepared for laboratory, field, and device-side measurement. Within the XCAL ecosystem, VQML® will be provided through two primary measurement configurations. The first embeds VQML® into XCAL to evaluate the perceived quality of OTT and live-video services played on mobile devices. By analyzing decoded RGB video together with XCAL measurement data, this configuration supports mobile-service benchmarking, field testing, device comparison, and QoE monitoring under real network conditions. The second configuration targets external playback devices. Video output from Apple TV, Chromecast, and comparable set-top boxes or streaming dongles can be ingested through an external HDMI video-capture device and evaluated using VQML®’s pixel-based no-reference analysis. This enables objective comparison across devices, applications, and service platforms without requiring access to the original source video or internal application metadata. As the next stage of commercialization, LIG Accuver plans to offer VQML® as a commercially licensed software development kit (SDK). The SDK will enable customers to integrate the J.344-aligned assessment engine into their own products, validation systems, monitoring platforms, and service-assurance workflows, extending VQML® beyond the XCAL ecosystem. 4. Conclusion Video quality assessment is becoming an essential component of network and service assurance. As 5G Standalone and future 6G networks support application-specific SLAs, private networks, mission-critical services, and immersive media, network-centric KPIs alone cannot fully represent the quality experienced by users. VQML® addresses this gap through AI-based no-reference assessment of decoded RGB video. Its selection as Model A within the ITU-T J.344 standardization framework provides a common technical basis for Full HD no-reference video quality assessment, while the commercial implementation extends its applicability across broader resolutions, codecs, devices, and service environments. Integrated with XCAL, VQML® connects predicted perceptual quality with radio, protocol, playback, and device-level information, enabling repeatable service comparison and more focused investigation of QoE degradation. Through future commercial SDK licensing, customers will also be able to embed the J.344-aligned VQML® engine into their own products, validation platforms, and service-assurance workflows. This combination of international standardization, AI-based perceptual assessment, and flexible deployment positions VQML® as a scalable foundation for video QoE assurance in the 5G and 6G era. Selected Standards and Technical References • ITU-T J.144 — Objective perceptual video quality measurement techniques for digital cable television in the presence of a full reference. • ITU-T J.246 — Perceptual visual quality measurement techniques for multimedia services over digital cable television networks using reduced reference. • ITU-T J.343 series — Hybrid perceptual bitstream and pixel-based objective video quality measurement. • ITU-T J.344, J.344.1, and J.344.2 — Approved no-reference objective video quality assessment framework and models for Full HD video. • ITU-T P.910 — Subjective video quality assessment methods for multimedia applications. • ITU-T P.1204 series — Video quality assessment models for streaming services. • LIG Accuver VQML® evaluation results on the ITU-T standardization dataset and severe coding-artifact dataset (internally verified). About LIG Accuver LIG Accuver provides advanced test and validation solutions across 5G/6G, O-RAN, NTN, V2X, and mission-critical communications. Its portfolio supports network operators, equipment vendors, device manufacturers, automotive partners, and public-sector organizations across laboratory, field, and service-assurance environments.For more information: sales@accuver.com | www.ligaccuver.com VQML® is a registered trademark of LIG Accuver. Product and company names referenced in this document may be trademarks of their respective owners.
Jul 23, 2026
-

- From Network KPIs to Real User Experience: Rethinking Quality in 5G SA
- As 5G SA adoption accelerates, network performance alone no longer reflects user experience. Even when throughput and latency meet target levels, users may still encounter buffering, resolution drops, or delayed responsiveness?highlighting a critical reality: good QoS does not always translate into good QoE. Why QoE Matters More in the 5G SA EraThe shift toward experience-centric quality is being driven by the growth of real-time services, the expansion of OTT and adaptive streaming, and rising demand for enterprise-grade service assurance. Network quality must therefore be evaluated not only by infrastructure metrics, but also by how services are actually delivered and experienced. Why KPI-Based Evaluation Is No Longer EnoughTraditional KPI-based evaluation has clear limitations. Adaptive bitrate streaming can hide underlying network issues, while average-based metrics often fail to capture short but highly impactful degradation events. User experience is not defined by averages, but by moments. In 5G SA, perception depends not only on throughput, but also on consistency, responsiveness, and service continuity across different applications and environments. For many emerging services, experience is strongly influenced by packet delay variation, packet loss behavior, sustainable bitrate, transmission gaps, and service availability under realistic traffic conditions. In other words, quality is not only about speed, but also about how predictably and reliably services respond. What Experience-Centric Validation Requires To make QoE measurable and actionable at scale, a more structured validation approach is needed.A QoE-driven framework should combine network performance, service-level behavior, and perceptual quality. This makes it possible to evaluate how users actually experience services such as video streaming, web browsing, cloud applications, messaging, and real-time communication.Experience-centric validation must also be fair, repeatable, and comparable. Test conditions should therefore be controlled through harmonized methods, synchronized measurements, representative service scenarios, consistent device conditions, and neutral test configurations. To be effective in practice, QoE validation must also be scalable. That requires standardized environments, automated testing, centralized analytics, and validation based on real commercial devices and real application behavior, not only synthetic traffic. How Accuver Enables Scalable QoE Validation Accuver supports this transition through an integrated validation framework designed for real-world network environments.XCAL enables reliable field testing and service-level measurement under live network conditions. It supports QoE evaluation not only for voice and video calls, but also for OTT and messaging applications such as WhatsApp and other app-based services. It can be deployed across mobility scenarios, 24/7 continuous monitoring, indoor locations, and non-terrestrial network (NTN) scenarios. XCAL also incorporates Accuver’s VQML™ technology, which delivers real-time objective video quality assessment based on machine learning. XCAL-Manager strengthens this framework with centralized control, automation, and real-time monitoring for large-scale operations. It supports repeatable testing, statistical comparison across devices and network environments, and automation that reduces time and manpower. XCAP extends this workflow with advanced post-processing and QoE analytics, helping teams correlate network behavior with actual service outcomes and user experience. Its AI-based root cause analysis capabilities also provide guidance on likely causes and recommended follow-up actions. Together, these capabilities support continuous monitoring, multi-device validation, service benchmarking, and AI-based video quality assessment across diverse deployment environments. Closing the Gap Between Network Performance and Real ExperienceExperience-centric validation is becoming essential across diverse markets and use cases. It is increasingly relevant for nationwide benchmarking, regulatory assessment, device evaluation, service launch verification, software comparison, mobility scenarios, and large-scale operational monitoring. QoE-driven validation is no longer experimental. It is becoming a practical requirement for understanding how network quality is actually delivered to end users. As networks evolve, so must the definition of quality. Network performance shows what a network is capable of, but user experience determines the quality users actually receive. Accuver helps operators, vendors, and ecosystem partners close this gap through an integrated approach that combines standardized testing, automated measurement, and service-level analytics across real-world network environments.
Apr 24, 2026
-
- Bridging Lab Emulation and Field Probing for Repeatable NTN Validation
- The wireless communication landscape is undergoing a radical shift as Non-Terrestrial Networks (NTN) move from theory to reality. We have entered an era of \"coverage without boundaries,\" driven by an unprecedented scale of satellite deployment. As of early 2026, the number of active Low Earth Orbit (LEO) satellites has surged past 12,500, creating a dense celestial network designed to eliminate global coverage gaps. This orbital infrastructure now supports over 10 million satellite broadband subscribers worldwide, while the emerging \"Direct-to-Device\" (D2D) market is projected to connect a potential audience of over 2 billion people through global cellular integration. However, the leap to space comes with unique technical hurdles. The extreme altitudes of Low Earth Orbit (LEO) introduce massive propagation delays, while the high velocity of satellites creates significant Doppler shifts that can disrupt traditional mobile protocols. Ensuring seamless connectivity between these satellites and ground devices requires a rigorous, dual-phase testing strategy―beginning with high-fidelity simulation in a controlled lab environment and concluding with extensive optimization under real-world field conditions. Accuver is proud to introduce a complete end-to-end NTN test suite designed to empower UE manufacturers, base station developers, and network operators to navigate this high-stakes frontier with confidence. NTN Satellite Link Simulation & Analysis In the lab, the primary challenge lies in replicating the physical realities of space without the prohibitive expense of an actual launch. XCAT-SPACE, Accuver’s 3GPP-based channel emulator, is specifically engineered to simulate wireless channels for satellite and aerospace. By connecting an NTN terminal and a base station simulator to XCAT-SPACE, users can recreate a \"NTN channel environment\" that accurately reflects Doppler shift effects and large-scale time delays.XCAT-SPACE enables controlled and repeatable NTN validation, allowing developers to test their systems against thousands of orbital scenarios in a fraction of the time. This is achieved by precisely simulating LEO-based satellite link conditions―including dynamic propagation delays, complex Doppler effects, orbital mobility, and multi-satellite visibility―ensuring every aspect of the satellite link is rigorously accounted for.The system provides dynamic satellite mobility based on actual orbits. Users can manually configure altitude, trajectory, and terminal movement paths, or achieve even higher precision by automatically importing TLE (Two-Line Element) orbit data. This flexibility allows for comprehensive 5G NR NTN terminal testing and D2D LTE end-to-end validation. For those requiring a perfectly isolated environment, pairing XCAT-SPACE with Accuver’s XCAT-SmartShield or XCAT-Shield Box provides a high-fidelity Over-the-Air (OTA) testing setup. These highly controlled conditions closely approximate wired connections, minimizing external RF uncertainty while preserving essential OTA characteristics. By combining satellite channel emulation with controlled OTA testing, Lab validation supports accurate and repeatable evaluation of NTN devices prior to Field verification. To translate this simulation into meaningful intelligence, XCAP, a post-processing solution, delivers specialized NTN analysis. Since satellite base stations are constantly in motion, XCAP uses 3D map visualization and automated TLE (Two-Line Element) data to correlate RF KPIs with precise satellite positions, azimuth, and elevation at the moment of measurement. This provides a clear performance baseline for 5G NR NTN and D2D solutions across major chipsets. Managing these complex testing cycles is streamlined by XCAP-AMS, a web-based automation platform. By centralizing system control and test reporting into an intuitive web UI, XCAP-AMS eliminates location dependency and reduces operational complexity. Together, this ecosystem―from XCAT-SPACE’s high-fidelity emulation to XCAP’s orbital insights and XCAP-AMS’s centralized management―provides a seamless, repeatable path for NTN device evaluation prior to field verification. 24/7 Unmanned Satellite D2C Monitoring Solution Field verification is the essential step in validating NTN performance under real orbital and network conditions. Accuver enables this through a 24/7 unmanned satellite D2C monitoring solution , designed to capture RF performance, service availability, and mobility behavior across distributed locations using live LEO satellites. At the heart of field operations are specialized measurement probes tailored for mission-critical NTN environments. For deployments in regions where terrestrial networks are unavailable―such as mountainous areas, deserts, or polar zones―the XR-Emb provides a rugged, IP54-rated solution. It ensures stable, automated testing (Ping, PS Call, SMS) in extreme outdoor conditions, supporting real-time status monitoring and failover handling for emergency or remote operations. For multi-UE monitoring, the XR-Pu6 enables continuous 24/7 benchmarking of up to six devices simultaneously. This ensures that operators never miss critical testing opportunities caused by unpredictable satellite pass times, providing a robust verification of satellite coverage and D2C (Direct-to-Cell) performance in the field. These distributed field units are centrally managed by XCAL-Manager, a server platform that eliminates the need for on-site engineers in remote or inaccessible areas. Operators can remotely distribute measurement schedules, monitor satellite links in real-time, and receive automated alarms for network anomalies, significantly reducing OPEX. All measurement data from these multiple sites is then aggregated via XCAP-AMS for consistent data handling and unified platform management. For large-scale or geographically distributed deployments, XCAP serves as the centralized engine for deep-dive analysis. This post-processing solution correlates RF KPIs with real-time satellite dynamics―including azimuth, elevation, Doppler shifts, and free space path loss―derived from TLE-based orbit information. This end-to-end field ecosystem ensures that NTN services are rigorously monitored and optimized in the real world, from the remote edge to the central cloud. Unified NTN Validation Workflow Accuver’s NTN solution provides:ㆍSatellite link simulation, controlled OTA testing, and baseline analysis in the LabㆍContinuous 24/7 unmanned D2C monitoring in the FieldㆍCentralized operation, data aggregation, and integrated analysisㆍConsistent KPI correlation across Lab and Field environments Together, these capabilities support a single, structured NTN validation workflow from simulation to live satellite operation. Conclusion NTN validation requires both controlled simulation and real-satellite verification. Accuver delivers a structured, end-to-end NTN validation solution that enables reliable deployment, efficient troubleshooting, and continuous optimization of satellite-based networks.
Jan 19, 2026
-
- Transforming In-Building Benchmarking: Automated Multi-Terminal Analysis Powered by XCAP
- In-building benchmarking often relies on data collected from multiple operators and mixed terminal environments. When measurements lack consistent metadata or synchronization, post-processing becomes slow, manual, and error-proneㅡmaking it difficult to generate unified and repeatable building-wide KPI results, particularly in multi-operator scenarios. Customer Challenge Traditional in-building workflows force engineers to manually align logs, classify floors, and prepare operator comparison reports. Multi-device sessionsㅡeach with different measurement modes, timestamps, or metadataㅡfurther increase complexity and reduce efficiency. Producing a consistent, building-level analysis therefore demands significant manual effort and is difficult to scale. XCAP Solution XCAP eliminates these inefficiencies by automating core in-building analysis tasks. The platform consolidates logs from diverse terminals, aligns them to a unified building structure, and generates standardized outputs within minutes. With automated classification, comparison, and KPI processing, XCAP delivers a scalable, repeatable, and operator-agnostic indoor testing workflow. Key Capabilities1. Get In-building Data Imports floor plans and in-building statistics from another log model and applies them to sessions that lack in-building metadata.- Supports mixed terminal environments- Time Offset option aligns logs with minor timestamp differences- Same-time validation ensures data integrity 2. Automated Floor Classification Automatically detects and separates measurements by floor, reducing manual review and accelerating analysis for multi-story buildings. 3. Multi-Operator Delta Comparison Generates reference-based delta coverage and differential KPI charts, enabling fast and accurate operator-to-operator evaluation on a unified layout. 4. Spatial Binning Creates virtual analysis grids for zone-level KPI evaluation (RSRP, RSRQ, SINR), improving readability and precision for location-based comparisons. 5. Unified KPI Statistics Provides building-level and floor-level summaries, including:- Technology distribution (5G SA/NSA, LTE)- Signal strength and quality indicators- Floor-specific coverage visualization Conclusion XCAP streamlines in-building benchmarking by reducing post-processing time, standardizing reporting across diverse logs, and improving the accuracy of multi-operator comparison. With automated data integration and consistent, repeatable reporting, engineering teams can identify coverage gaps and performance issues more quicklyㅡallowing them to focus on network optimization rather than manual log alignment.
Nov 24, 2025
-

- XCAP-Based Connectivity Characterization for D2C and NTN Environments
- Analyzing communication performance in Direct-to-Cell (D2C) and NTN environments is inherently complex due to continuously changing satellite orbit, geometry, and RF conditions throughout a satellite pass. Interpreting UE measurement logs solely at the KPI level is insufficient to explain why connectivity is established, maintained, or lost. Effective analysis requires correlation of measurement data with satellite motion and observation conditions along common time and spatial axes.XCAP provides an analysis environment that correlates UE measurement data with satellite orbit, geometry, and Doppler behavior, enabling condition-based interpretation of connectivity behavior in NTN environments. This approach allows complex satellite connectivity phenomena to be analyzed beyond standalone KPI outcomes, focusing instead on the conditions under which they occur.1. Satellite KPI VisualizationXCAP automatically reconstructs satellite position, orbit, and observation KPIs for past measurements based on recorded satellite communication data. This enables examination of satellite environment conditions and communication quality at the exact time of measurement within a unified analysis view.Such visualization allows RF KPIs to be interpreted not as isolated performance values, but in the context of the satellite’s elevation and azimuth at the time of observation. As a result, identical KPI values can be distinguished based on differing satellite geometry conditions, supporting more accurate interpretation of connectivity behavior.- 3D Satellite Map : Visualizes time-based satellite orbit movement together with communication measurement data- Polar Phase Map : Displays satellite trajectory using Elevation and Azimuth for observation condition analysis- RF KPI Summary : Provides RSRP, SINR, Handover, and other major RF KPIs based on measurement logs- Satellite KPI Summary : Shows changes in tracking KPIs observed during the measurement period2. 5G NTN Satellite Test AnalysisXCAP analyzes UE connectivity behavior as satellites enter and move through the field of view, identifying which satellite the UE was connected to at each moment and under what conditions connectivity was retained or lost. By correlating log data with time-varying satellite geometry, the analysis characterizes connectivity behavior under realistic D2C and satellite mobility scenarios.Connectivity events such as service loss, RSRP degradation, and handover are aligned with satellite trajectory, enabling recurring event patterns to be identified along specific orbital segments rather than treated as isolated occurrences. This supports interpretation of UE connectivity behavior as a continuous process across a satellite pass. - Classification of RRC Measurement Report events by time, location, and event type - Analysis of handover delay and mobility-related conditions - Evaluation of satellite link retention time - Examination of link variability caused by satellite movement or environmental factors3. Doppler Effect AnalysisLEO satellites introduce significant Doppler frequency shifts due to high orbital velocity. XCAP provides dedicated analysis capabilities to evaluate Doppler variation and its impact on connectivity stability.Doppler variation is analyzed as a function of satellite geometry, enabling differentiation between Doppler-induced effects and RF performance changes driven by propagation or environmental factors. Alignment of measured KPIs with TLE-based orbital models further allows comparison between expected and observed performance trends along a satellite pass. - Analysis of Doppler frequency shift during satellite communication - Correlation of signal variation with satellite Elevation and Azimuth - Presentation of satellite observation KPIs aligned with Doppler behavior - KPI prediction and comparison using TLE-based orbital models - GPS-based orbit mapping for geometry-to-KPI correlationConclusionXCAP treats UE connectivity behavior in satellite-based networks as a function of orbital motion, geometry, and Doppler conditions rather than isolated KPI outcomes. This enables more precise interpretation of NTN and Direct-to-Cell connectivity characteristics, supporting condition-based understanding of connectivity behavior in dynamic satellite environments.
Nov 24, 2025
-

- Connectivity, and the Future of Vehicle Safety: From Euro NCAP Incentives to Global Mass Rollout
- The automotive industry is entering a new phase in which connectivity is no longer viewed as an optional feature but as a critical enabler of road safety. With Euro NCAP’s decision to include connectivity in its safety rating framework starting in the near future, connected vehicle technologies are gaining formal recognition as part of a vehicle’s overall safety performance. This upcoming change is expected to accelerate the adoption of Vehicle-to-Everything (V2X) technologies, placing them at the center of global automotive strategies. Background: Connectivity and Vision ZeroThe European Union’s Vision Zero initiative, which aims to eliminate road fatalities by 2050, has made connectivity a cornerstone of its strategy. By enabling vehicles to share and receive real-time hazard information, connectivity reduces the likelihood of accidents caused by unforeseen road conditions, limited visibility, or delayed human reactions. Euro NCAP, a widely influential vehicle safety assessment program, has announced that connectivity will be incorporated into its star rating system. While not yet enforced, this policy change provides a clear signal to automakers: future ratings will reward vehicles equipped with connectivity features, and consumer demand will follow.Industry Implications OEMs1. Incentive to integrate connectivity features to achieve higher Euro NCAP ratings.2. Easier internal justification for investment since higher ratings influence sales.3. Need to ensure interoperability and participation in shared data ecosystems. Regulators and Road Authorities1. Gain access to real-time hazard and traffic data from connected vehicles.2. Enhanced ability to manage infrastructure safety (e.g., roadworks, weather, wrong-way driving). Customers1. Receive earlier warnings of hazards such as slippery roads, obstacles, or congestion.2. Benefit from safer vehicles without relying on paid services or third-party apps. Industry Ecosystem1. Establishes a data-sharing culture where safety information flows across brands.2. Accelerates market readiness for advanced applications (e.g., emergency vehicle alerts, end-of-queue warnings, sensor data fusion). This announcement sets the stage for rapid adoption. Historically, once Euro NCAP introduces new assessment categories, they quickly become industry standards. Connectivity is expected to follow the same trajectory, from incentive, to widespread adoption, to potential regulation.Accuver’s Role in the Connectivity EcosystemAccuver contributes to the evolving connectivity and V2X ecosystem by providing comprehensive, end-to-end solutions that bridge today’s testing needs with tomorrow’s deployment challenges:- V2N Solutions: Developed in collaboration with leading automotive electronics companies, Accuver enables secure and scalable Vehicle-to-Network integration for connected services.- V2X Modules: Provide reliable, standards-compliant connectivity for vehicles, enabling seamless communication across V2V, V2I, and V2N use cases.- V2X Test Solutions: Cover both physical layer and application layer validation, ensuring interoperability and performance under both real-world and lab conditions.- On-Board Units (OBUs): Extend connectivity to vehicles without integrated V2X modules and support Vulnerable Road Users (VRUs), ensuring broader ecosystem inclusion.- eCall Testing Automation: Automates the manual eCall validation process, delivering higher efficiency, repeatability, and accuracy in ensuring compliance and functional reliability.By offering these solutions, Accuver helps automakers, regulators, and technology providers validate, deploy, and scale connected safety systems. This ensures that connectivity is not only a rating requirement but also a reliable, interoperable, and future-proof component of the road safety ecosystem. ConclusionConnectivity has not yet been fully implemented into Euro NCAP’s rating system, but its planned inclusion signals a clear direction for the industry. V2X technologies are poised to become a core component of vehicle safety, with profound implications for automakers, regulators, and consumers. Accuver’s role is to accelerate this transition. Through V2X modules, OBUs, and comprehensive testing platforms, Accuver equips the industry with the tools required to validate technologies today and prepare for their integration into global safety frameworks tomorrow. By enabling reliable, interoperable, and scalable deployments, Accuver turns policy announcements into measurable road safety outcomes, fully aligned with the long-term goals of Vision Zero.
Oct 22, 2025
-

- [Case Study] XCAL-VQML Deployed at Major Network Vendor’s R&D Center
- The rapid growth of video-based communication, ranging from streaming services to enterprise conferencing, has made video quality assurance a critical requirement for operators and telecommunication equipment vendors. Unlike traditional KPIs such as throughput or latency, video quality is inherently subjective and influenced by multiple factors at device, service platform, and network levels. - How does the network affect actual video quality as perceived by end users?Traditional testing approaches, which rely on physical cameras or manual MOS evaluations, made it difficult to:- Eliminate environmental variables such as lighting or device handling.As a result, the R&D team struggled to build confidence in their ability to benchmark video service quality under real-world conditions accurately.XCAL-VQML OverviewAccuver provided the XCAL-VQML solution, an AI-based video quality assessment framework designed to deliver accurate MOS values without requiring original reference videos.Key capabilities included:AI-powered MOS Prediction:Supports widely used services such as YouTube, WhatsApp, WeChat, Skype, Microsoft Teams, etc., reflecting actual end-user experiences.Controlled Measurement Environment:OutcomeThe deployment produced tangible results:- Repeatable MOS values were achieved, proving that XCAL-VQML could reliably measure how the network impacts perceived video quality.These results demonstrate that XCAL-VQML produces reliable and reproducible video quality scores, even under varying device or application conditions. - Understand the real impact of network conditions on video quality.- Accelerate innovation in video communication in the mobile network.ConclusionFor this usage, the deployment of XCAL-VQML transformed a critical challenge into a breakthrough success. What began as doubts about how to measure video quality ended with a proven framework for reliable, scalable testing.
Sep 25, 2025
-

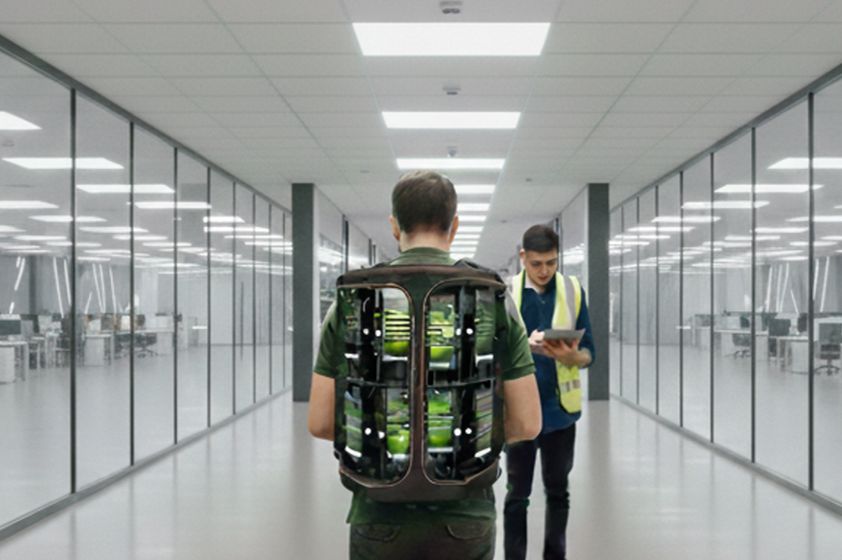
- [Case Study] XCAL-Ranger: Continuous 24/7 Measurement Across Train, NTN, and Private 5G
- With the rapid evolution of 5G, private networks in industrial environments and NTN communication, the demand for automated, robust, and scalable monitoring solutions is increasing worldwide. Ensuring reliable connectivity is now a critical requirement not only for consumer satisfaction but also for mission-critical applications across transportation, satellite, and smart manufacturing sectors. XCAL-Ranger addresses these emerging needs by providing continuous, 24/7 monitoring and control in even the most challenging environments. 1. Continuous Network Quality Monitoring in Transportation (Rail, Metro, Maritime)Transportation systems such as trains, subways, and ships require stable connectivity to ensure both passenger satisfaction and operational safety. XCAL-Ranger enables continuous and automated measurement of network quality by being mounted directly onto moving vehicles. Challenges- Harsh environments such as tunnels, underground stations, and offshore conditions can impact measurement stability- Maintaining reliable installation and stable power supply on moving vehicle- Data synchronization and remote monitoring may require robust Backhaul connectivityApplication- Mounted in trains or subways, it collects service quality data while moving through tunnels, stations, and high-speed tracks- Installed on ships or ferries, it monitors coastal and offshore coverage, detecting areas of weak or unstable connectivity- Data can be integrated into passenger information systems, safety applications, or QoS dashboards for operatorsBenefits- Identify coverage gaps and service blind spots in real-time- Support network optimization projects by correlating measurement results with passenger complaints- Supports compliance with regulatory standards while enhancing passenger experience- Ensures robust, stable, and 24/7 monitoring and control even in harsh and mobile environments2. Automated Testing of Direct-to-Device (D2D) Satellite Communications with LEODirect-to-Device (D2D) satellite communication with Low Earth Orbit (LEO) constellations enables smartphones and IoT devices to connect directly to satellites. Such communication windows are short and dynamic, requiring automated, scheduled testing. Challenges- Satellite pass times are short and require precise scheduling for meaningful testing- Environmental factors such as weather or urban obstructions can interfere with satellite signal acquisition- Logging and analyzing intermittent test data requires advanced automation and coordinationApplication- XCAL-Ranger is configured to periodically attempt satellite connections whenever a LEO satellite passes overhead- Automated tests include signal acquisition, call attempts, and data session initiation with direct-to-device satellites- Logs are uploaded remotely for performance evaluation of LEO network readinessBenefits- Provides continuous validation of satellite coverage in test locations without human intervention- Enables R&D; teams and operators to benchmark satellite service performance- Reduces missed test opportunities caused by unpredictable satellite pass timings- Guarantees robust, stable, and 24/7 automated testing of satellite communication, even under unpredictable conditions3. Assurance of Private 5G Networks in Smart FactoriesPrivate 5G networks are increasingly deployed in industrial environments to support automation, robotics, and mission-critical communications. Ensuring stable network performance in such dynamic environments are essential. Challenges- Factory environments are subject to heavy interference from machinery and structural obstacles- Maintaining continuous monitoring across large and complex sites can be resource-intensive- Security and privacy concerns may arise when integrating monitoring solutions into operational networksApplication- XCAL-Ranger is deployed across a smart factory floor to run continuous performance checks- Automated test scripts validate connectivity, latency, and application service performance for AGVs, robots, and wireless sensors- Device status and performance data are centrally monitored through the XCAL-Manager platformBenefits- Guarantees that 5G-enabled devices operate seamlessly in production environments- Reduces downtime by proactively detecting network degradation- Provides auditable network performance reports for enterprise customers and regulators- Delivers robust, stable, and 24/7 monitoring and control, ensuring reliability in demanding industrial settings XCAL-Ranger transforms traditional, labor-intensive network testing into a fully automated, scalable, and reliable monitoring system. Whether in transportation systems, satellitecommunications, or smart factories, XCAL-Ranger ensures robust, stable, and around-the-clock monitoring and control even in the most challenging environments making next-generation connectivity truly dependable.
Sep 24, 2025
-
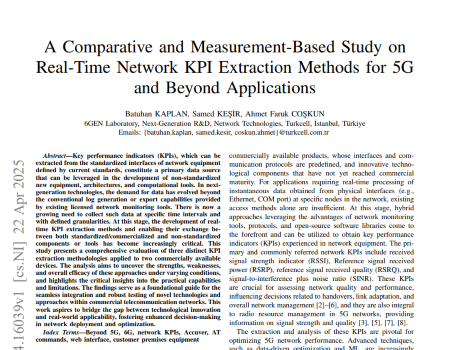
- A Comparative and Measurement-Based Study on Real-Time Network KPI Extraction Methods for 5G…
- Turkcell, Turkiye’s leading telecom provider, has advanced its 5G research using Accuver’s XCAL to evaluate real-time KPI extraction from 5G networks. This study highlights XCAL’s accuracy, fast refresh rate, and stable performance in measuring key indicators like RSRP, RSRQ, and SINR.XCAL’s advanced features enabled precise and reliable analysis, offering a key competitive advantage in 5G performance evaluation. The full paper is available on arXiv for those seeking more insights.We sincerely thank Turkcell, one of our key customers, for their continued research efforts in advancing 5G innovation with XCAL.
Jun 11, 2025


